Pie & Doughnut Chart
Pie & Doughnut Chart is to use for showing various kind of 2-dimensional datas on the chart. On this chart, you can observe the special data by clicking the other legends.
How to create Pie & Doughnut Chart Widget?
Step 1. Create, or choose the Column into which you want to add your element. Click on Add New Element.
Step 2. Drag UDesign Pie Chart element from the element List.
Step 3. Choose Chart Type and add Items.
Pie & Doughnut Chart Option.
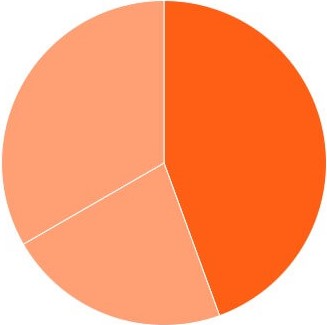
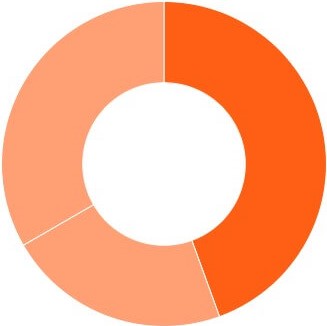
Chart Type – You can select pie or doughnut chart.
Value – You can set custom value of item data. Chart is shown this value ratio.
Legend – With legend options, you will determine position of legend and layout.
Tooltip – This option enable to show tooltip for chart.
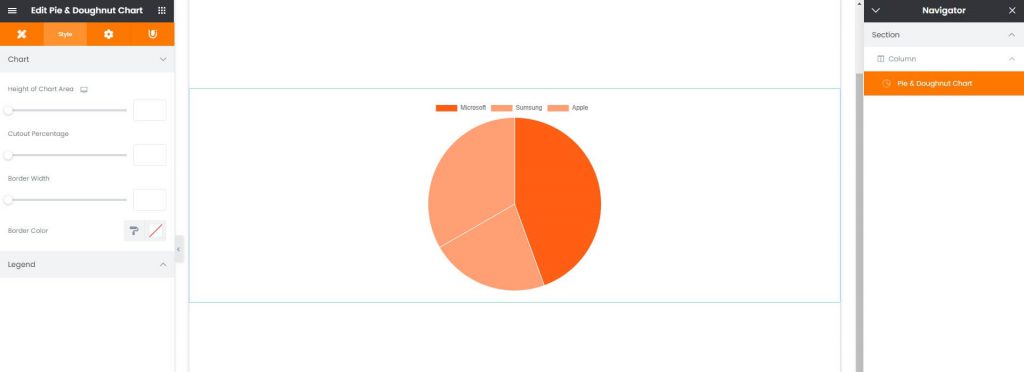
Pie & Doughnut Chart Style.
You can control height, border width of chart, color and point size with Height of Chart, Border Width, Line Color, Point Size Options.