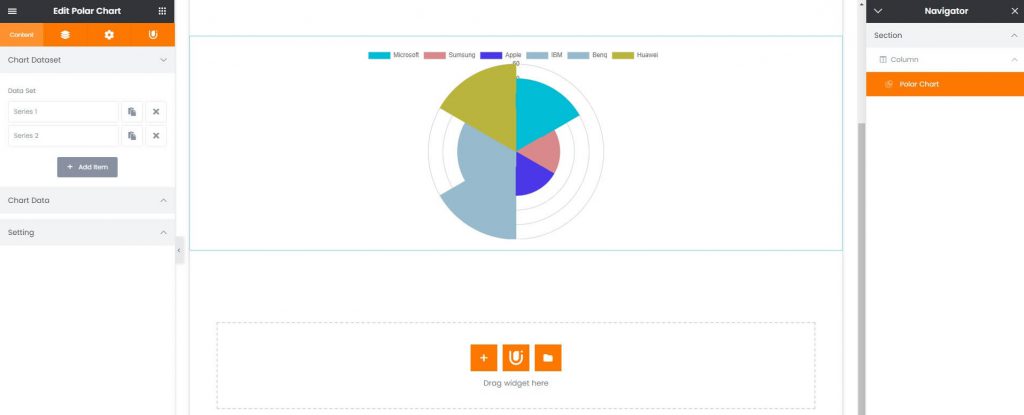
Polar Chart
Polar Chart is to use for showing various kind of 2-dimensional datas on the chart. On the chart, you can observe the special data by clicking the other legends.

How to create Polar Chart Widget?
Step 1. Create, or choose the Column into which you want to add your element. Click on Add New Element.
Step 2. Drag UDesign Polar Chart element from the element List.
Step 3. Edit Data Set and add Items.
You should set number of Items’ value the same as numbers of Data Set or the chart will not be able to be shown value of items.
Polar Chart Option.
Dataset Label – You can set the label of dataset.
Data Value – You should enter multiple values divided by comma without whitespace according to the count of datasets. Example: if you have 2 datasets, you should input two values, 40,50. First is for dataset 1 and second is for dataset 2.
The legend is able to be displayed anywhere. Top, Bottom, Left, Right. These setting is controlled by Legend options.
Polar Chart Style.
You can control height with Height of Polar Area and here you can set typography of legend.
