Bar Chart
With UDesign Bar Chart, you can container and show data more intuitive.
How to create Bar Chart element?
Step 1. Create, or choose the Column into which you want to add your element. Click on Add New Element.
Step 2. Drag UDesign Bar Chart element from the Element List.
Step 3. Add and edit the cart item.
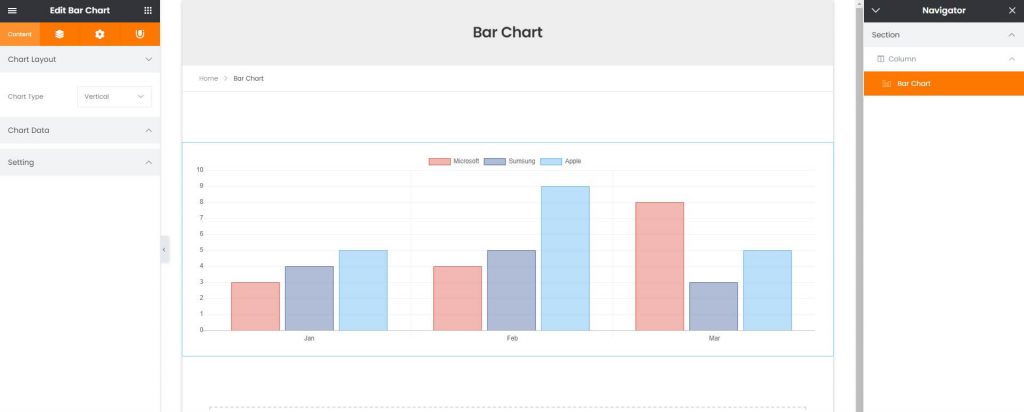
Bar Chart Options
Chart Type – Select the chart type to show Vertical or Hoizontal.
Data Labels – Set labels of data axis. Write multiple labels separated by comma.
Label of Items – Set label of each bar chart.
Value of Items – Set data value separated by comma.
Show Grid Line – Determines whether grid lines are shown or not.
Axis Range – Set maximum value of range that can be set for the data value.
Axis Unit – Set scale of the axis to show data value.
Show Axis Labels – Choose whether labels should be displayed. Default currently set to on.
Show Legend – Enable to show legend for polar chart.
Position – Control the position of legend on polar chart.
Reverse – Legend would be rearranged in reverse.
Show Tooltip– Enable to show tooltip for polar chart.